REPORT
DESCRIPTIONSAnchor
(Vehicle Master Database)
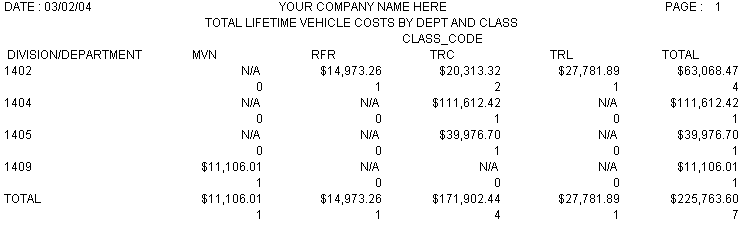
This Matrix or cross tabulation report prints the entire lifetime vehicle costs and breaks them out by department and Class Code. All lifetime costs are reported. You will be prompted to enter the facility number as well as the class code, department, and vehicle ranges.
This report is ESSENTIAL for the fleet manager. It contains all lifetime cost information for vehicles by departments and class.
Prints the following information:
Matrix is sorted by: Department and class code
Shows total life costs by department and vehicle class codes. Also gives the vehicle count for those vehicles that fall into the particular department/class categories.
(Vehicle Master Database)
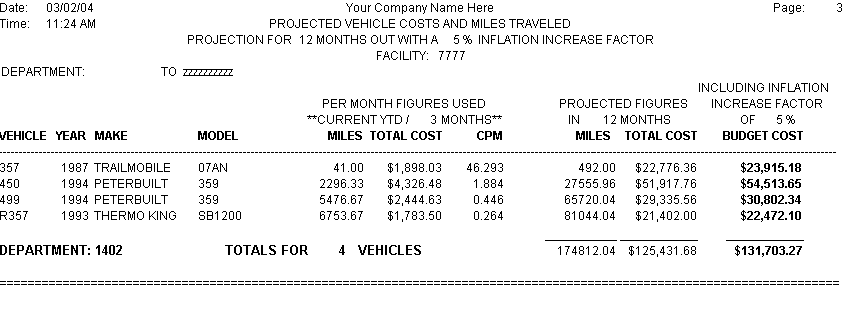
This report calculates a monthly miles and vehicle costs based on the yearly totals divided by the number of months since the last end of year process. Then these figures get extended out for the number of months the user inputs into the report prompt. Also in this report you can factor in an inflation percentage to add to the projected total. You will be prompted to select a facility, months since the last year closing, starting and ending department range, the number of months to project out, and inflation percentage.
This report would be great for those who have to work under a budget and have to provide figures for a new budget year. Also these figures can be used to help identify vehicles that need to be replaced.
Prints the following information:
Report is sorted by: Department
Vehicle number
Vehicle year
Vehicle make
Vehicle model
Calculated current miles
Calculated current cost
Calculated cost per mile
Projected miles
Projected cost
Projected cost with inflation percent added
Subtotals by Department, and Grand Totals on all the projected fields.
(Vehicle Master Database)
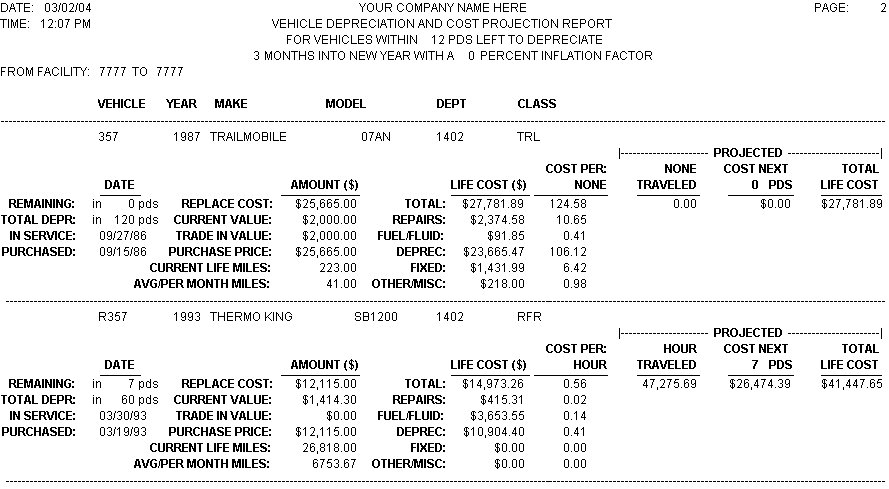
Note: You will need to be utilizing the vehicle depreciation schedule found in MVM or 111 in order to pull info for this report.
This report displays all the pertinent information from the vehicles depreciation schedule, plus it shows lifetime cost and cost per unit based on the vehicles primary meter. Also it will show you projected units traveled, cost for the remaining periods left to depreciate and total cost. The projected costs can include an inflation percentage as well. You will be prompted to select the facility, the number of periods remaining to depreciate (less than or equal to the number input), the number of months since the end of year closing and inflation percentage.
This report may assist in determining vehicles that should be replaced as well as keep track of the depreciation information on the vehicles in the fleet.
Prints the following information:
Report is sorted by: Facility, department, purchase date, and vehicle
Includes all the depreciation info
Current life miles
Average month miles
Life costs & cost per unit
Projected units traveled and cost (based on remaining periods to depreciate)
Projected total life cost (projected plus actual costs added)
(Vehicle Master Database)
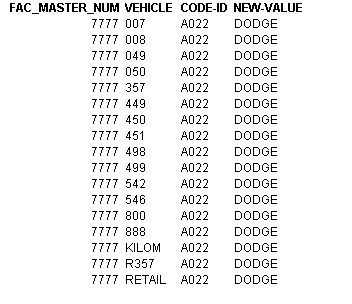
This report is designed to be used in conjunction with the Global Vehicle change routine found in the Custom Utilities II RTA Global utilities package. You will be prompted to select the facility and vehicle number range, field code*, and new value.
When executing this report to a file it produces a fixed ASCII text file named vtrec.prt that the global vehicle change program in RTA uses to chosen fields in the Vehicle master file.
Note: See documentation on the Global Vehicle Change in the Custom Utilities II package for more details on how to use.
Prints the following:
Report is sorted by:
Facility
Vehicle number
Code ID*
New value (up to 20 characters)
*Code ID see global vehicle documentation this code identifies which field in the RTA vehicle file gets replaced with the new-value information.
(Parts Master Database)
This Columnar list is designed so it can be exported out to a file such as Excel or ASCII.
This report provides a basic list of your parts flagged in RTA as consignment. You will be prompted to select the facility and part number range.
Prints the following:
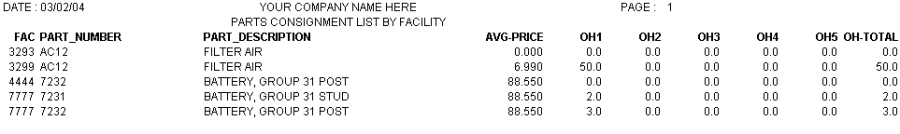
Report is sorted by: Facility
Facility number
Part number
Part description
Average price
On hand levels for all five stocking areas
On hand Total
(Parts Master Database)
This is similar to the Consignment Part List but it is formatted as a Crystal Report and includes a report header, subtotals by facility, and grand total.
This report provides a nicer formatted layout of your parts flagged in RTA as consignment. You will be prompted to select the facility and part number range.
Prints the following:
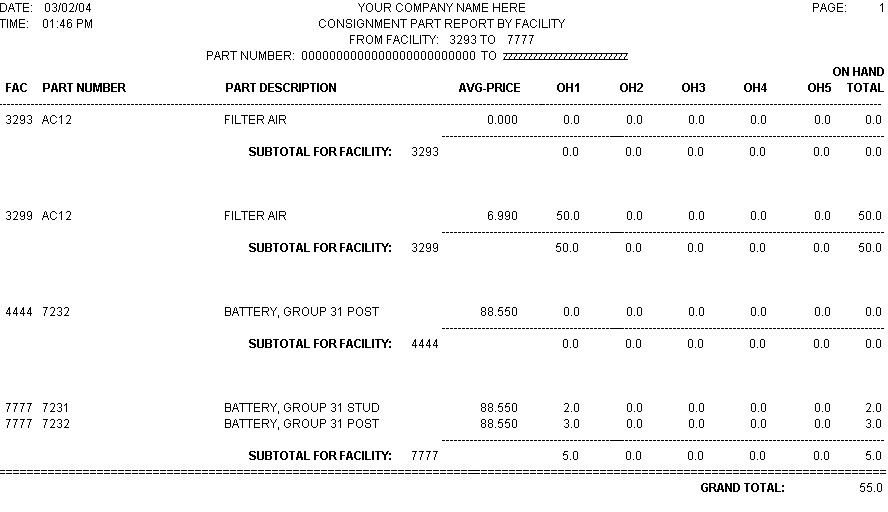
Report is sorted by: Facility
Facility number
Part number
Part description
Average price
On hand levels for all five stocking areas
On hand Total
Subtotals on Facility and a grand total on the total on hand.
(Parts Master Database)
Note: This report utilizes the reorder information in the part master screen MPM or 5111 and the Standard Reorder point setting in SSP or 8117 Line# 22. If you don't have valid reorder information or are using the Calculated method the suggested quantities will not calculate correctly.
This report prints a list of parts that exceed the suggested inventory quantity, which is calculated by using the reorder, point and reorder quantity information in the parts master screen. It also pulls parts over a user inputted "excess" dollar amount. You will be prompted to select the facility, part number range and an x factor for the excess amount.
This report can be used to help reduce overhead and streamline the parts inventory or it can be used to identify parts that may have reorder points set wrong in the part file.
Prints the following:
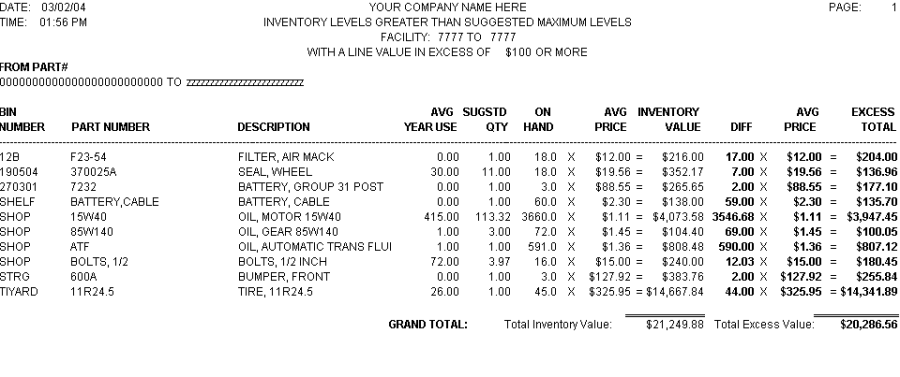
Report is sorted by: Bin location and part number
Bin number
Part number
Part Description
Average Year Usage
Suggested on hand quantity (reorder point minus 1 plus reorder quantity)
On hand
Average price
Inventory value (on hand times average price)
Difference (On hand minus suggested quantity)
Average price
Excess total
Grand Totals: On Inventory value and Excess value
(Parts Master Database)
This report calculates a per day usage and projects this figure out for as many days as the user identifies and is organized by facility and vendor. You will be prompted to select a facility range and the number of days out you want to project for.
This provides useful information that can be used to either help budget out for your parts or it can be used to preorder your parts when you are on vacation.
Note: the quantities were intentionally not rounded to give you the flexibility to order more or less then the recommended amounts or you may have parts that can be ordered in fractional increments.
Prints the following:
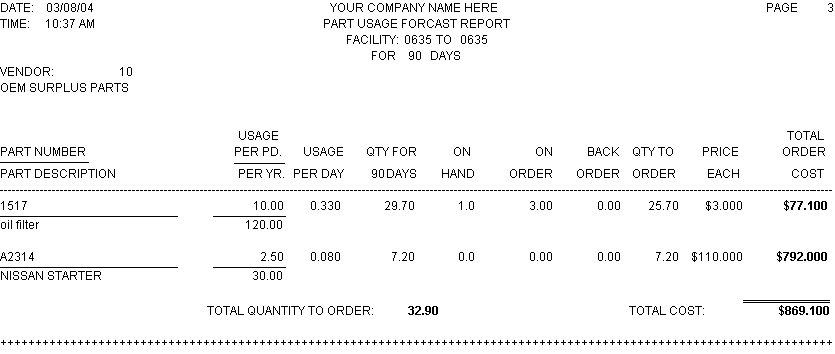
Report is sorted by: Bin location and part number
Part number/description
Usage per period/Year
Per day usage (Average year divided by 365 days)
Quantity needed for X days (Days use times prompted days out)
On hand total
On order quantity
Back order quantity
Quantity to Order (qty needed – on hand – on order – back order)
Average price
Total cost of order
Subtotals by vendor and facility on quantities to order and total cost. Grand total on total cost.
(Part Master Database)
This report prints part transfer transactions. You will be prompted to select for outbound or inbound transactions and the date range. The outbound will show the credit transactions or the "from" facility transactions while the inbound will show the positive amounts or the "to" facility transactions.
Prints the following:
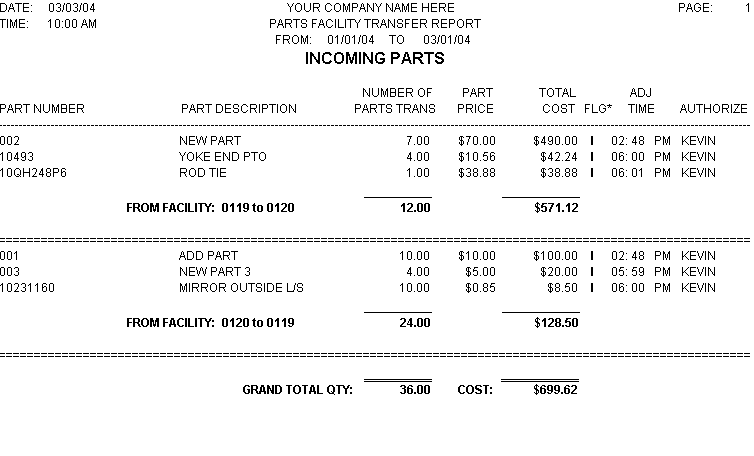
Report is sorted by: The facilities involved in transfer and the time the transfer took place.
Part Number
Part Description
Number of parts transferred
Part price at time of transfer
Total cost
Flag* (I=incoming parts O=Outbound part)
Adjustment time
Person who authorized
Subtotals for transfer facilities and Grand totals on part quantities and total cost.
(Parts Master Database)
This report prints out a list of parts that are in inventory that have a year usage less than or equal to a user prompted number and were last received prior to a user prompted date. You are prompted for a facility and bin range, as well as a threshold date (will be used to pull last purchases prior to this date), and a usage number.
This report may be used to help identify slow moving parts to reduce overhead.
Prints the following:
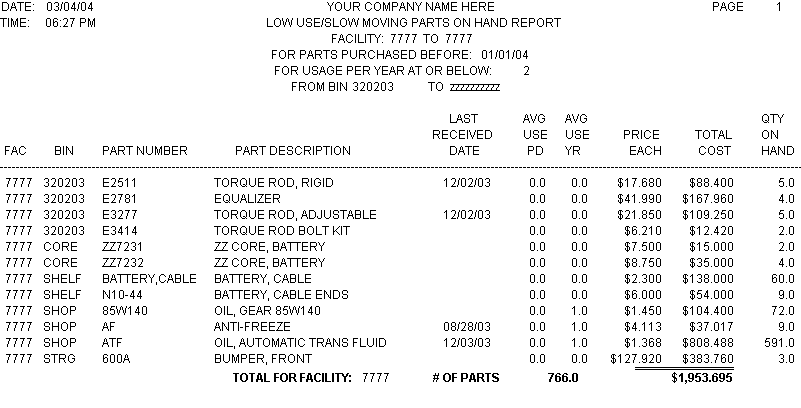
Report is sorted by: Facility, bin location, and part number
Part facility number
Bin location
Part number
Part description
Last receive date
Average use per period
Average use per year
Average price
Total cost
Total on hand quantity
Subtotal by facility on number of parts and total cost and grand total on number of parts and total cost.
(Parts Master Database)
This Columnar list is designed so it can be exported out to a file such as Excel or ASCII it also utilizes the "Classification" field in the part master screen (MPM or 5111) to help narrow down part groupings such as air filters, oil filters etc. You are prompted for a facility and part range, as well as part classification.
This list is designed to give you a quick part bid sheet and with the ability to export out to a file such as Excel. If you decide to export into a spreadsheet the nice thing is you can input the incoming bid sheets into the spreadsheet to get a direct side-by-side comparison for those parts in the bid list.
Prints the following:
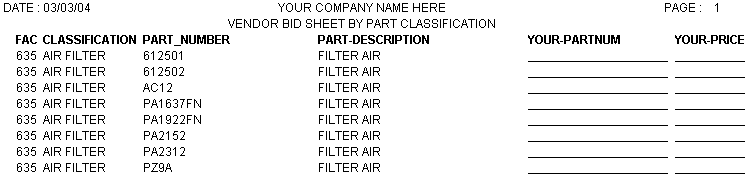
List is sorted by Facility, Classification, and part number
Part facility
Part Classification
Part number
Part description
Vendors part number (to be filled in by vendor)
Vendors part price (to be filled in by vendor)
(Repair Order Database)
This report prints repair totals for each vehicle that has had repairs and accumulates the repair totals for the repair years 1990-2009. You will be prompted to select a facility and department range.
This will provide the fleet manager longitudinal information on vehicle repairs. This can be used to help with replacement/life cycle costs or help out with future budgeting for vehicle maintenance.
Prints the following:
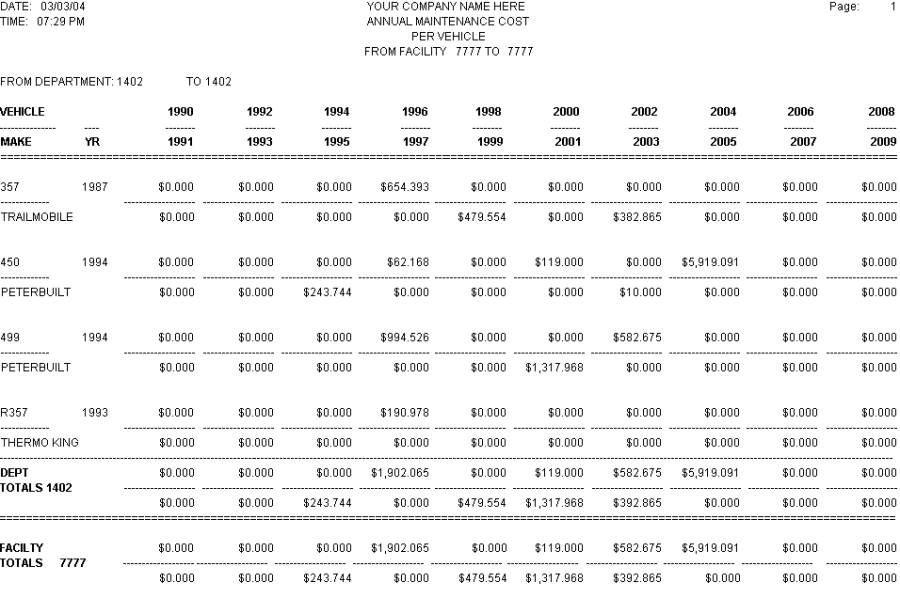
Report is sorted by: Facility, Department and Vehicle
Vehicle number/ vehicle make
Vehicle year
Repair year totals (1990-2009)
Subtotals by Facility and department number on repair year totals. Grand totals on repair year totals.
(Repair Order Database)
This report prints a list of vehicles that have had repairs done x number of days back. It displays one line per vehicle and shows the last closed work order number, last close date, user prompted number of days back the last repair was done, and a count of the number of work orders that took place on this vehicle during the time frame (days back). You will be prompted to select the facility and number of days back you want to search for work orders (will pull work orders that are less than or equal to the number of days the user identifies).
This can help the fleet manager identify problem child vehicles, non-problem vehicles, vehicles not being utilized and/or vehicles that haven't had PM work done in a timely manner.
Prints the following:
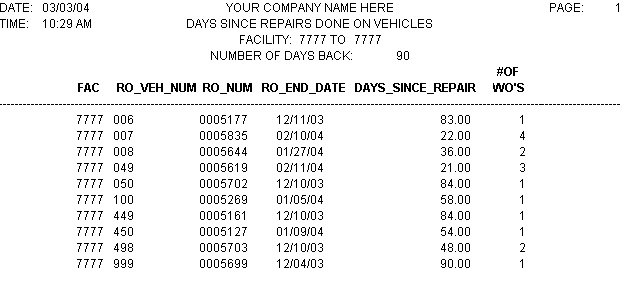
Report is sorted by: Facility, vehicle, work order number and days since repair.
Facility number
Last work order number
Last work order completion date
Days since last repair
Number of work orders cut against the vehicle during this time
(Repair Order Database)
This report prints total repair order costs and organizes the output by facility, customer and reason code. You will be prompted to select a facility and department range.
This report will give you the ability to organize and group the work order information into customer and reason code categories.
Prints the following:
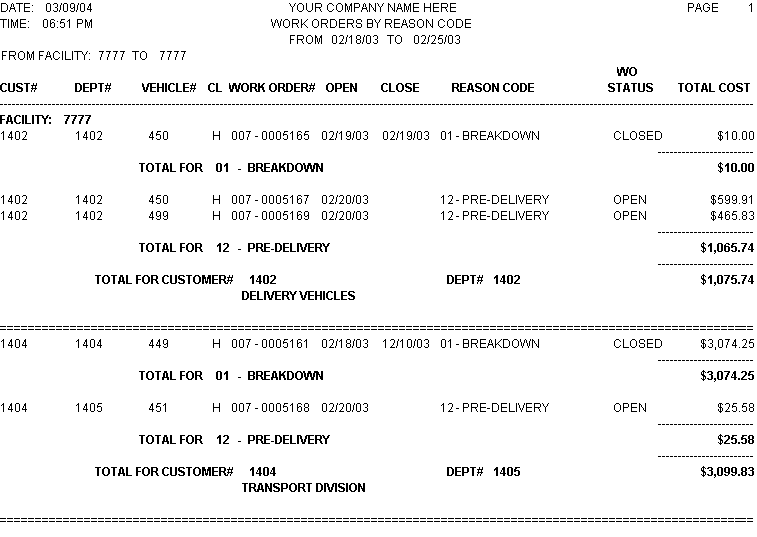
Report is sorted by: Facility, customer, reason code, work order end date and vehicle number
Grouped by facility
Customer number
Department number
Vehicle number
Vehicle class
Work order number (including work order facility)
Work order create date
Work order end date
Reason code with description
Work order status (open or closed)
Total repair cost for work order (excluding shop supplies and taxes)
Subtotals by Customer and reason code on total cost. Grand totals on total cost.
(Repair Order Database)
This report prints a summary of work order costs for vehicles organized by class code. You will be prompted to select a facility and range of work order create dates.
This report gives a quick cost overview of all class codes in a specific facility. This allows the fleet manager general cost data for his different vehicle classes and serves as an excellent month and/or year end summary report.
Prints the following:
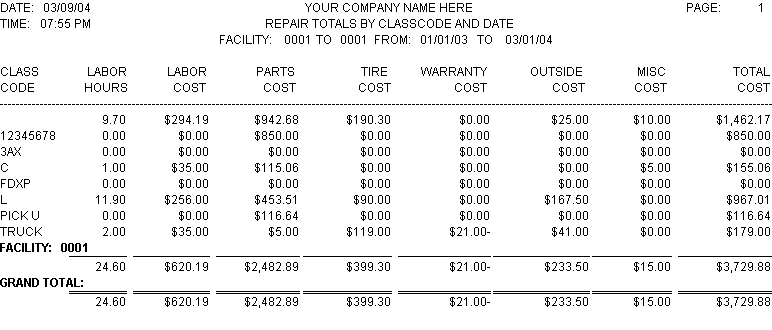
Report is sorted by: Facility and class code
Vehicle class code
Labor hours
Labor cost
Parts cost
Tire cost
Warranty cost
Outside costs
Misc cost
Total of all costs and credits above
Subtotals by Facility and Grand totals on all fields except class code.
(Vendor Info Database)
Note: This report only pulls Blanket PO information. If you don't use blankets then this report will not pull any data.
This report pulls the blanket vendor information including expiration and budget information. This report will prompt for a facility and vendor range.
This can be used to review current blanket budgets including running balances, total and budget used.
Prints the following:
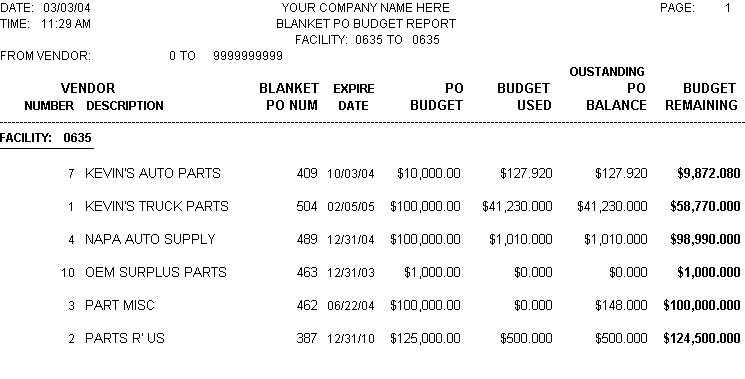
Report is sorted by: Facility and vendor name
Facility number
Vendor number
Vendor name
Blanket PO number
Blanket expiration date
Total blanket budget
Budget used
Outstanding balance (includes amounts that are currently on open PO's)
Budget remaining (total budget – budget used)
CUSTOMER RECORD REVIEW
(Customer Database)
This is a simple but useful report that prints out the current customer information including: customer contact, address, markups, and rates. This also calculates a base shop labor rate that you enter at a prompt and multiplies it by the labor markup to show what exactly what rate the customer pays and it also displays the customer codes found in the account information screen in the RTA vendor master screen (MCM or 831). You will be prompted for a facility, customer and a base shop rate to apply in the report.
This report is great to review and update customer information in the RTA system.
Prints the following:
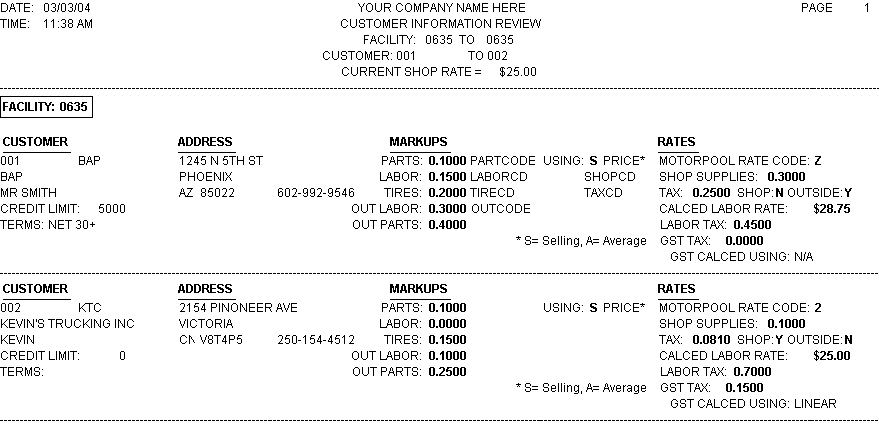
Report is sorted by: Facility and customer number
Includes:
Customer contact and address
Credit limit
Customer terms
Markups
Customer codes (found in the account information screen (MCM)
Rates (including calculated labor rate)
(Vehicle Odometer Audit Trans)
Background:
Fully implemented in the 6.0 version of RTA is the odometer audit transactions file. This file records odometer changes behind the scenes from any module in RTA that can update the odometer excluding the fuel module since transactions are created already on the fuel side.
This report prints all the behind the scenes odometer change transactions before and after the change and thus will allow you to track down those pesky odometer entry errors. You will be prompted for a facility, vehicle, and audit transaction date range.
Prints the following:
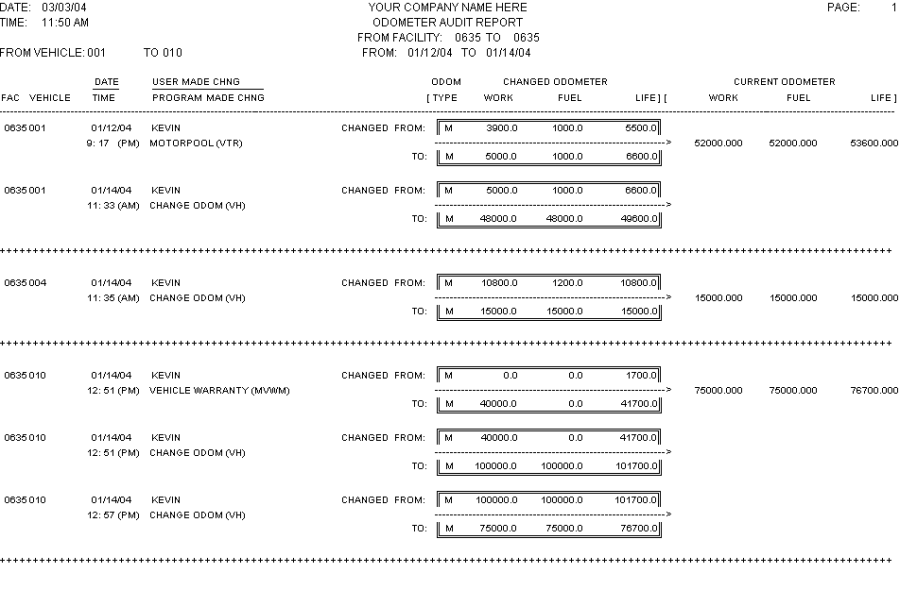
Report is sorted by: Facility, vehicle number, and audit transaction date
Includes:
Facility number
Vehicle number
Date/time the transaction took place
User and program name the change was made from (i.e. change odometers, work order etc.)
Changed "from" and "to" for odometer type, work, fuel, and life odometers
Current work, fuel, and life odometers in the vehicle file
(Paperless Labor Transactions)
Note: This report pulls from paperless transactions only the same as our accountability report (RSA or 3913) does in RTA and will not include any labor totals that were manually entered in the work order module itself. Also if you do not use paperless shop you will not pull any data into this report.
This report pulls mechanic labor hours from the paperless labor transactions. It summarizes the labor hours by major VMRS code, vehicle number and the mechanic as well as a grand total for the date range entered. You will be prompted for a facility, mechanic, and date range.
Prints the following:
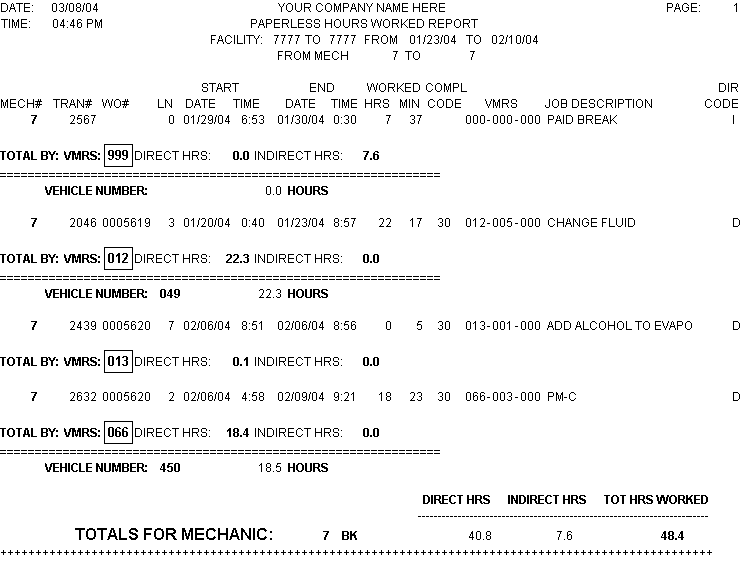
Report is sorted by: Mechanic number, vehicle, major VMRS, transaction number, and date started
Continued:
Shows the following transaction detail:
Mechanic number
Paperless transaction number
Work order number
Work order line number
Start date/time
Ending date/time
Hours/minutes worked
Completion code
VMRS code
Job description
Direct labor code
Subtotal by major VMRS and vehicle number for direct and indirect labor.
Subtotal by mechanic for direct labor, indirect labor, and total hours worked.
Grand total for direct labor, indirect labor, and total hours worked.
(Parts on Requisition Data)
This is a simple but useful report that pulls the requisitions you have in a particular facility and organizes them by vendor number and part number. Also includes an area to write in a count if you use this to check current inventory on the requisitioned parts prior to ordering.
If you use requisitions this report is great for the parts manager and/or the person ordering parts. It provides a simplified and customizable list of all the current requisitions. You will be prompted to select one facility and a start and ending vendor number.
Prints the following:
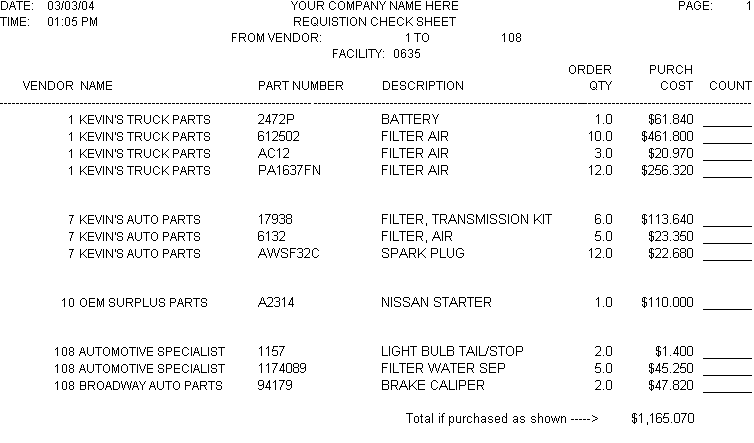
Report is sorted by: Vendor number and part number
Vendor number
Vendor name
Part number
Part description
Order quantity
Purchase cost (qty to order times average price)
User inputted count line
Grand total on the purchase cost.
(Pump and Tank Database)
This is for those of you that have to manually enter pump and tank readings into the RTA system.
This is a simple but effective form that can be printed out and used to write down pump meter and tank stick readings to be later inputted into RTA. You will be prompted to select one facility, one or all fuel types and an end of week date (the date is printed at the top of the report so you know what week the readings are for).
Prints the following:
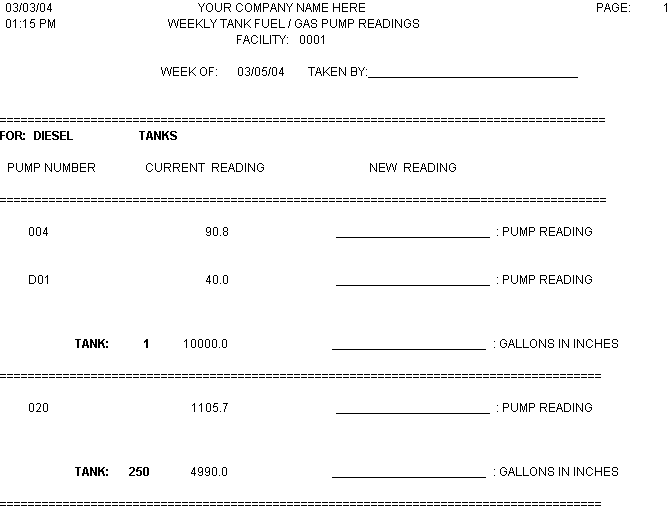
Report is sorted by: Fuel type, tank, and pump number
Displays the fuel type
Pump numbers and tank they are attached to
Current pump and stick readings
Place to write in new readings
(Purchase Order Database)
This report displays and organizes purchase order costs by facility and vendor within a particular date range. This report displays one line per PO. You will be prompted for a facility, vendor, and receive date ranges.
Prints the following:
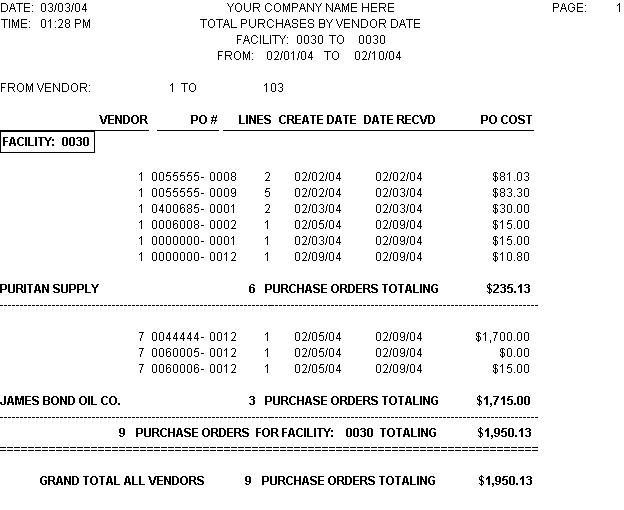
Report is sorted by: Facility and vendor number
Facility number
Vendor number
Purchase order number (including extension number)
Number of lines on the PO
Create date
Receive date
Total PO cost
Subtotals by vendor and Facility on the number of PO's and PO cost.
Grand totals on the number of PO's and PO cost.
VEHICLE COST PER MILE REPORT
(Vehicle Master Database)
This report prints all the vehicle costs and cost per mile. sorted by department number. Both current period and year to date costs are reported. You will be prompted to enter the beginning date of the current period, the starting date of your fiscal period, and the facility number.
This report is ESSENTIAL for the fleet manager. It contains all pertinent cost information for vehicles and departments.
Prints the following:
vehicle number
vehicle year
vehicle make
vehicle model
fuel type
miles traveled for period and year
fuel cost for period and year
oil cost for period and year
labor cost for period and year
parts cost for period and year
tires cost for period and year
miscellaneous cost for period and year
outside cost for period and year
fixed cost for period and year
total cost for period and year
cost per mile for period and year
Subtotals the following:
number of vehicles in the department
Subtotals and Grand Totals on the following:
miles traveled for period and yearfixed cost for period and year
fuel cost for period and yeartotal cost for period and year
oil cost for period and yearcost per mile for period and year
labor cost for period and yearaverage per mile for period and year
parts cost for period and year
tires cost for period and year
miscellaneous cost for period and year
outside cost for period and year
(Vehicle Master Database)
This report prints the current odometer reading and the miles traveled for the current period, year, and life. You will be prompted to select the starting and ending vehicle number range and facility range.
This will provide mileage information for fleet and department managers, which can help to identify monthly trends, possible vehicle odometer corrections needed, and vehicle utilization.
Prints the following:
vehicle facility
vehicle number
vehicle year
vehicle make
vehicle model
current period miles traveled
year to date miles traveled
life to date miles traveled
last fuel odometer
last work order odometer
difference between fuel odometer and work order odometer ("add miles")
Subtotals the following:
current period miles traveled
year to date miles traveled
life to date miles traveled
"add miles"
Grand totals:
current period miles traveled
year to date miles traveled
life to date miles traveled
"add miles"
(Vehicle Fueling History Database)
This report will calculate the miles per gallon and miles per quart of oil based on information entered in the fueling module for a specific department. You will be prompted to select the date range and the department number.
This may assist in determining a "problem" vehicle. Vehicles that are abnormally low in either miles per gallon or miles per quart may need to be brought in early for service. Vehicles which are abnormally high in miles per gallon may have missing fuel tickets.
Prints the following:
vehicle number
distance traveled
total gallons of fuel posted
total quarts of oil posted
miles per gallon
miles per quart
Grand Totals on:
distance traveled
total gallons of fuel posted
total quarts of oil posted
miles per gallon
miles per quart
(Vehicle Fueling History Database)
This report prints the amount of oil posted in the fueling module. You will be prompted to select the vehicle number range and the date range.
This provides a detailed listing of all oil consumed and may serve as backup to the "Fuel and Oil Mileage Report" included in this package. This does not include oil used in oil changes in the totals.
Prints the following:
transaction facility
vehicle number
fueling date
odometer at time of fueling
price per quart of oil
oil quantity posted
total oil cost posted
Subtotals and Grand totals the following:
oil quantity posted
total oil cost
(Repair Order Database)
This report prints damage repairs done on vehicles in a specified date range. You will be prompted to select the date range, which is based on the work order posting date. The damage repair is determined when the repair code type #4 Damage is used when a work order line is created.
This report provides documentation for identifying accident costs for the fleet. The total dollar value could then be viewed as "above and beyond" the standard operating cost of fleet maintenance and thus be budgeted separately. Also, trends may be noticed regarding location, or VMRS number, of damages. For example, if the corners of trailers have been damaged often, adding an extra convex mirror may be considered.
Prints the following:
vehicle number
work order facility
work order number
work order posting date
VMRS code
work description (VMRS code description)
total damage cost posted
Subtotals the following:
total damage cost for vehicles in facility
Grand totals the following:
total damage cost
(Repair Order Database)
This report prints costs for work orders by VMRS code. You will be prompted to select the VMRS code range and the date range. Date range is based on work order posting date.
This report will give history by a specific VMRS code, which can be used to find problem areas in vehicles, isolate "call backs", and give totals for those specific jobs.
Prints the following:
vehicle number
odometer reading at time of work order creation
work order number
work order posting date
VMRS code
work description (VMRS code description)
labor cost
parts cost
tires cost
outside parts or labor cost
warranty credits
miscellaneous cost
Subtotals:
number of occurrences by major VMRS code
total cost by major VMRS code
labor cost by major VMRS code
parts cost by major VMRS code
tires cost by major VMRS code
outside parts or labor cost by major VMRS code
warranty credits by major VMRS code
miscellaneous cost by major VMRS code
Grand Totals:
number of occurrences/transactions posted in specified range
labor cost
parts cost
tire cost
outside parts or labor cost
warranty credits
miscellaneous cost
(Repair Order Database)
This report prints a history of repairs by VMRS code for a specific department and vehicle class. You will be prompted to select the department, vehicle class and transaction date range.
This provides the fleet manager with a quick reference as to the type of repairs being done to specific departments and vehicle classes.
Prints the following:
major VMRS code
number of occurrences
total labor hours
total labor cost
total part cost
total tire cost
total warranty credit
total outside cost
total of above costs and credit
cost percentage of grand total
Grand totals the following:
labor hours
labor cost
part cost
tire cost
warranty credit
outside cost
total of above costs and credit
(Repair Order Database)
This report prints the average labor hours for inside repairs posted to work orders by VMRS code. You will be prompted to select the date range, which is based on work order closing date. Totals will be printed only for work order lines that have been closed.
This report will list the VMRS codes followed by the number of occurrences and average labor hours posted to each VMRS code.
This report can be helpful in evaluating and adjusting the estimate hours fields in the VMRS code file.
Prints the following:
VMRS code (major, intermediate, and minor)
work description (VMRS code description)
number of occurrences
average hours posted
(Repair Order Database)
This report prints work order transactions and costs, sorted by the customer number assigned on the work order. You are prompted for a transaction date range and customer number range. It will subtotal the costs by customer number and gives grand totals on the final page.
This report may be used as a "billing" invoice for specific departments or customers within your company or as general information for fleet management.
Since this report selects on the "transaction" date, or the date the specific work was done, there is no need to worry about having to close a work order at the end of the month. This report will separate the work performed and costs by the posting date.
Prints the following:
Vehicle number
Work order number
Transaction date
Type(1=check, 2=repair, etc.)
Work description
Labor cost
Parts cost
Tires cost
Outside(parts + labor) cost
Warranty credit
Miscellaneous cost
Subtotals by customer:
Total transaction cost
Labor cost
Parts cost
Tires cost
Outside cost
Warranty credit
Miscellaneous cost
Grand totals:
Total transaction cost
Labor cost
Parts cost
Tires cost
Outside cost
Warranty credit
Miscellaneous cost
(Repair Order Database)
This report prints a summary of work order costs for vehicles in a specified date range. Date range is based on work order close date. You specify the work order facility number and the date range.
This report gives a quick cost overview of all vehicles in a specific facility. This allows the fleet manager general cost data for his shop and serves as an excellent month and/or year end summary report.
Prints the following:
work order facility
vehicle number
vehicle year
vehicle make
vehicle model
vehicle class
total parts cost
total labor cost
total outside costs
total tires cost
total warranty credits
total of all costs and credits above
Grand totals the following:
total parts cost
total labor cost
total outside costs
total tires cost
total warranty credits
total of all costs and credits above
(Repair Order Database)
This report prints mechanic hours worked. You will be prompted to select the mechanic number range and the date range. Date range is based on work order posting date.
This will provide the fleet manager or shop foreman a detailed list of all the jobs any or all mechanics have worked on in the past day, week, month, or any time frame desired.
Prints the following:
mechanic number
mechanic abbreviation
work order facility
work order number
work order posting date
work description (VMRS code description)
hours posted
Subtotals by mechanic number:
number of jobs
hours posted for each mechanic
Grand totals the following:
total hours posted
(Mechanic Master File)
This report prints a list of your mechanics. You will be prompted to select the facility number range.
This will provide the fleet manager with a quick reference guide to all his mechanics.
Prints the following:
mechanic number
mechanic abbreviation
mechanic name
pay code
mechanic miscellaneous
billing type
mechanic wage
mechanic flat rate
Subtotals the following:
average mechanic wage by facility number
average mechanic flat rate by facility number
(Parts Master Database)
This report prints all parts for a range of account numbers. You will be prompted to select the starting and ending account number range and facility number. It will subtotal by account number and provide a grand total of the number of parts and the total value on hand.
This report will give you the ability to find specific totals of various parts, which may help in determining "overstock" areas. If you use the account number field for an actual internal account number, this will provide easy access to a list and total dollar value for these accounts. If you do not use or need account number information, this field may be used to split certain types of parts, such as vehicle type (Forklift/Truck/Auto), maintenance type (PM, accident damage, specific lifespan such as tires and batteries), etc. You can develop and setup your own depending on what types of parts you would like to see separately.
Prints the following:
part number
part description
selling(or "marked up")price
average price
quantity on hand, all 5 stocking areas combined
dollar value(average price times quantity on hand)
primary vendor number
primary vendor abbreviation
Subtotals by account number:
part account number
count of part numbers
on hand level
dollar value
Grand totals:
count of part numbers
on hand level
dollar value
(Parts Master Database)
This report prints a list of all non-stocking parts in your inventory that has a non-zero inventory level.
This will provide the parts manager a "hit list", or a list of parts that may need to be returned to the vendor.
Prints the following:
facility number
part number
part description
last purchase order date
last purchase order number
last invoice number
average price
total inventory on hand
extension (total price)
Subtotals the following:
Facility number
number of non-stock parts in facility
total value of non-stock inventory in facility
Grand totals:
number of non-stock parts
total value of non-stock inventory
(Parts Master Database)
This report prints parts by a range of parts markup percentages. It shows all parts with a certain markup percentage, their average and selling prices, on hand quantity, and extension. In the subtotals, it shows the total selling (retail) price, the average(cost) price, and the difference (profit). You are prompted for a range of markup percentages in tenths (do not use decimals in the prompt)
and part facility.
This may be used to check your markup percentages while also giving dollar totals, and comparing cost vs. retail prices.
Prints the following:
Part number
Part description
Part markup percentage
Selling or retail price
Average or cost price
Quantity on hand, all stocking areas
Value on hand(average price times quantity on hand)
Primary vendor number
Primary vendor abbreviation
Subtotals by markup percent:
Count of part numbers
Selling value(selling price times quantity on hand)
Cost value(average price times quantity on hand)
Difference or profit(selling value minus cost value)
Grand totals:
Count of part numbers
Selling value(selling price times quantity on hand)
Cost value(average price times quantity on hand)
Difference or profit(selling value minus cost value)
(Repair Order Database)
This report shows each work order line scheduled for a mechanic in a specific facility. This report will prompt you for the facility number and starting and ending mechanic number range. It will subtotal, by mechanic, hours scheduled and worked and give the total number of jobs scheduled.
This can be used as a scheduling sheet for the shop foreman, fleet manager, or service writer. The total hours scheduled can be a great indicator to see if one mechanic is over-extended, while another may be running out of work to do.
Prints the following:
Mechanic number
Vehicle number on work order
Work order date created
Work order number
Work order line number scheduled
VMRS code on the line
Description of work being done
Repair type(1=check, 2=repair, etc.)
Scheduled hours on work order line(from VMRS code)
Hours already worked on this job line
Subtotals by mechanic number:
Number of repairs
Hours scheduled
Hours already worked on job line
Grand totals:
Number of repairs
Hours scheduled
Hours already worked on job line
(Purchase Order Database)
This report shows all parts currently on order through purchase orders. It is sorted and subtotaled by part number. It prints the purchase order number and line number, along with the on-order quantity, ordered price, and extension.
You will be prompted for the starting and ending purchase order facility and starting and ending part number ranges.
This report is a must for the parts manager and/or the person receiving the purchase orders! It provides an excellent daily or weekly list of all open purchase orders, and can be used as a receiving document for the person responsible for checking in and verifying purchases received.
Prints the following:
Purchase order number
Purchase order line number
Part number on order
Part description
Quantity on order on that line
Ordered price on that line
Extension (on-order times price)
Grand totals:
Quantity of all parts on order in range
Extension of all parts on order in range
(Purchase Order Database)
This report prints all parts received sorted by account number. It shows the purchase order number, date and amount received, and subtotals, by account number, the received cost. You will be prompted for the purchase order facility and the starting and ending invoice date.
If you use, or are considering using account numbers, this is the report for you. This will give you totals broken out by account, which will give the parts and fleet managers a good look at what types of parts and/or services are being purchased.
Prints the following:
Purchase order number
Vendor name purchased from
Part number received
Part description
Date of invoice
Quantity received
Each price on this purchase order
Extension (quantity received times ordered price)
Subtotals by account number:
Extension (quantity received times ordered price)
Grand totals:
Extension (quantity received times ordered price)
(Parts Master Database)
This report prints Year to Date and Life to Date purchases accumulated in the RTA Vendor file. The year totals are zeroed out when the end of period is processed for a new year.
This report may be used to a keep as a running tally on your cumulative year to date and lifetime purchases for your vendors. These totals could be used by the parts manager and/or fleet manager for bidding or pricing information and can be used as both a budgeting and bargaining tool.
Prints the following:
Vendor number
Vendor abbreviation
Vendor name
Year to date total purchases
Life to date total purchases
Grand totals:
Number of vendors
Total year to date purchases
Total life to date purchases The below reports are all of the reports in our Best of Crystal Reports package
| Child pages (Children Display) |
|---|