The PM Compliance Report allows users to see what PM's were completed before, within, or after an acceptable range. In order to do this a new data table will be created to store this history information. This must be done so that historical data can be kept track of, even when a PM Interval may change.
This information is populated whenever a WO Line that is flagged as a PM is closed. At the time of closing, it will populate the amount of time / units past due or early and will take the meter on the WO and the posting date at the time of closing. If however, the PM Line is reopened, and then closed, it will not update this information. This is consistent with how PM's on a vehicle are updated after the PM Line is closed.
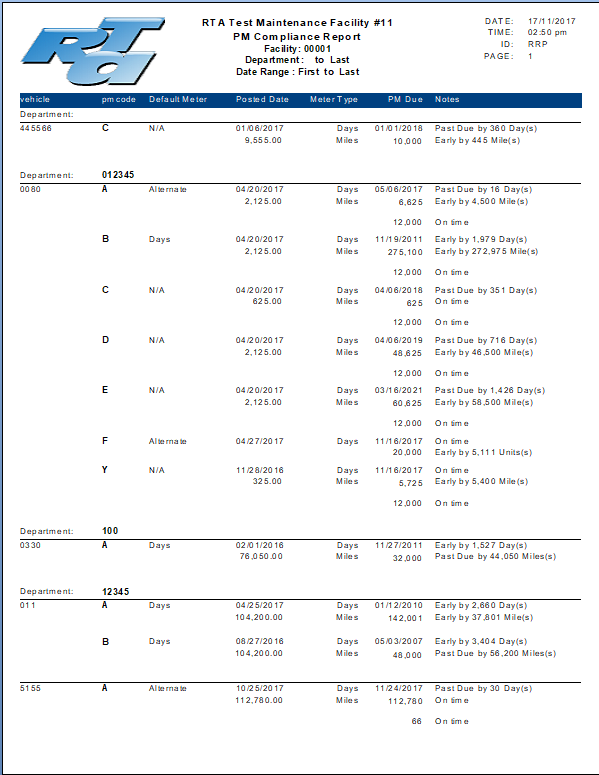
The report can be run by vehicle or department, and show only PM's who passed or failed the "acceptable zone"(determined by the meter / date parameter), or can be run to show all regardless of the status. This is very helpful to see if you are consistently performing PM's too early, too late, or just right. The acceptable range is defined before running the report, allowing users to play with "what-if scenarios". For example, if a PM was completed 300 miles after it was due, if your acceptable zone was -300 to 300 miles, it would be counted as "Done On Time". If your acceptable zone was -150 to 150, it would be counted as "Done Late". Currently this report will only check against the days past due, and the meter interval of the PM if available. Therefore, if a PM was done on time for the days, but was 5000 miles past due on an alternate meter, it will still be flagged as on time.
The report will display the Units/Days past due / early / if it was on time for each meter type, when it was posted for the meter type, and when it was due for the meter type.
At the end of each facility, and the grand totals page if ran for a region, there is a chart that displays. This will display differently according to the date range that you run it for.
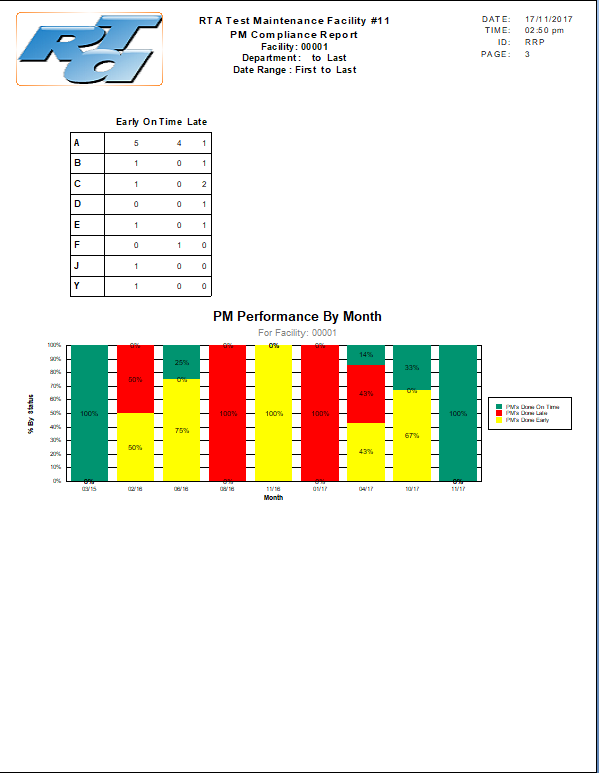
- 0 to 14 days: Will break out each day individually
- 15 days to 5 weeks: Will break out each week individually
- 6 weeks or more: Will break out each month individually
The chart displays the percentage of PM's that were done on time, late, or early, according to the breakout interval.
This is available for SQL ONLY.