In the design grid, you can:
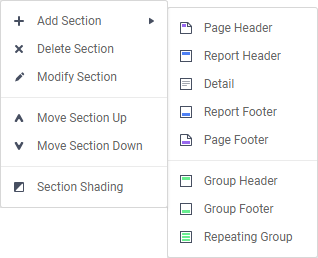
Sections dictate how the data appears in a report. There are five types of sections: page, report, details, group, and repeating group.
 Page Header &
  Page Footer
The rows in the Page Header section appear at the top of every page of a report, and the rows in the Page Footer section appears at the bottom of every page of a report. Typically, the Page Header section is used to designate column headers for a report, and the Page Footer section is used to display the page number and/or confidentiality notices for a report.
Page Headers and Page Footers are not intended to perform calculations or display data fields. For this reason, a Page Header populated with a data field will only return the first line of data in that field; a Page Footer will return only the last line of data.
Note: If you are printing a report, remember that Excel outputs do not have pages. Page Headers will appear only once at the beginning of the report. Reports run via the Report Viewer will display Page Headers similarly unless ‘Simulate PDF’ is checked in the Options menu.
 Report Header &
  Report Footer
The rows in the Report Header appear at the beginning of a report. Typically, these rows display the title of a report. The rows in the Report Footer appear at the end of a report. Typically, the Report Footer displays grand totals and summary information for the report.
 Detail
The Detail section is the main section of most reports. When the report is executed, the Details Section creates a row for each element in the Data Categories. For example, if the Detail section contains the Data Field Orders.OrderId, the report will display each Order Id on a separate row.
 Group Header &
  Group Footer
Group Header/Footer sections require a sort on a Data Field. The rows in a Group Header section will appear above the Detail section for each unique value of the sorted Data Field. Typically, Group Header sections are used to display data as labels. For example, a report may contain a Group Header on Orders.OrderDate and display Orders.OrderId in the Detail section. The output would display each date with orders that occurred on that date below them.
The rows in a Group Footer section will appear below the Detail section for each unique value of the sorted Data Field. Typically, Group Footer sections are used to calculate subtotals. For example, a report may contain a Group Footer on Orders.OrderDate which displays the number of orders made on each date.
Note: Group Header/Footer sections can also be set to display rows for each value of a formula instead of a Data Field. (Ex. The report may be sorted on the Data Field Orders.OrderDate, but the report should show subtotals for each month. A Group Footer on the formula =Month({Orders.OrderDate}) will display rows containing subtotals for each month.)
 Repeating Groups
Repeating Groups require a sort on a Data Field. Repeating Groups have their own header, detail, and footer subsections. Repeating Groups should only be used when the data has multiple one-to-many relationships and each should be rendered completely before the other.
For example, each Professor can teach multiple classes and advise multiple students. For each professor you want to see all the classes they teach and then all the students they advise.
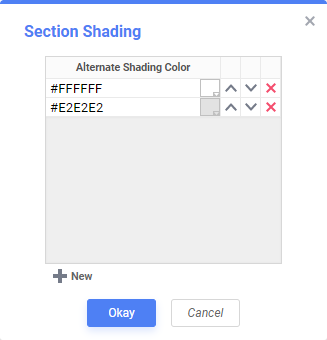
Sections can be added, deleted, modified, moved, and assigned shading.
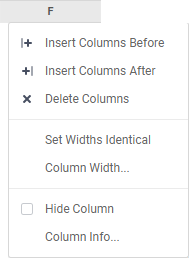
Columns and rows of cells can be added, modified, or removed as described below.
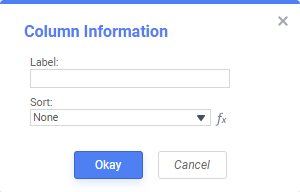
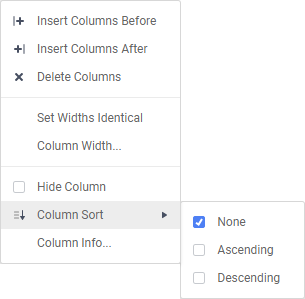
While viewing reports in the Report Viewer, a user can click the bar at the top of the report to sort by a column. For Express Reports, this is handled automatically but must be enabled for Advanced Reports.
To make a column sortable:
 ).
).Note: Column Sorts are applied after any sorts defined in the Sorts Menu.
Cells are the containers for all the information in a report. Cells may contain text, images, charts, or links to other reports.
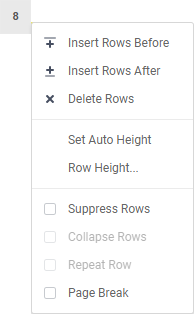
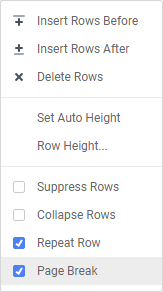
 buttons in the Toolbar.
For a Page Break to occur at the beginning of each element of a Data Field, place a page break on the top row of Group Header Section for that Data Field. See Sections for more detail on Group Header Sections.
A Group Section can be set to display as collapsed by default on HTML export. This causes the contents of the section to be suppressed and individually expandable for each change in Header. Collapsible rows are supported in the standard or Interactive HTML viewer. Non-HTML export formats will ignore Collapsible Rows.
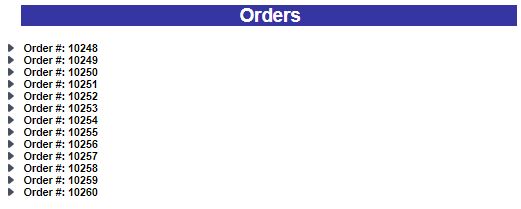
Left-click on an arrow next to a Collapsible Row to expand or collapse the group.
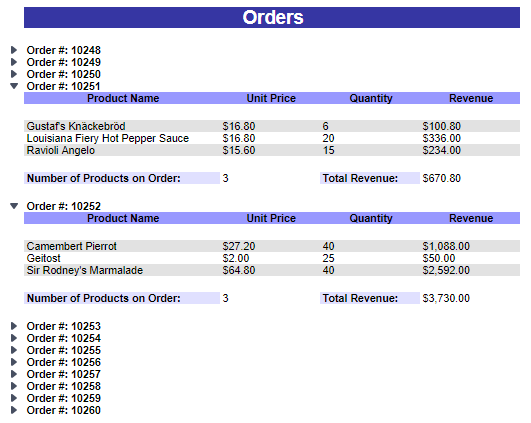
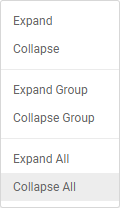
Right-click on an arrow next to a Collapsible Row to see additional display options:
To create a collapsible row, click on the desired row number in a Group Header Section and select Collapse Rows in the dropdown menu.
Collapsible Rows have the following properties when exported to HTML:
Note: Collapsed or expanded states cannot be saved to the Interactive HTML User Report preferences.