ExpressView Managing Data
You can exercise some fine grained control over the actual data that appears in the ExpressView. You can choose how the data appears, you can filter down the rows to appear, and you can change the order of rows in their respective sections.
Formatting data
Formatting allows you to specify a data type for specific data fields, and choose how that data displays.
To change the data type for a field:
Click the Formatting and Style
 icon to open the Formatting page.
Click the data rows to format. They will highlight in blue.
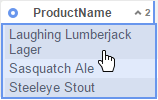
Selecting data to format
Click the Data Format tab.
From the Format Type list, select a data type from the following options:
General
Format the data using the default settings for your environment. The application will assume the data type.
Number
Format the data as a number. Continue to step 5.
Date
Format the data as a date, time, or date and time. Skip to step 6.
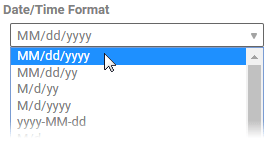
Choosing a date/time format
Text
Do not apply any formatting to the data, and show it exactly as it appears in the database
- Optional: If you selected Number you can choose how the number displays. You can customize the following options:
- In the Decimal Places field, enter a number for how many decimal places to display. In the field to the right, enter a symbol to use as the decimal mark.
- To show a delimiter every three digits, select Use 1000 Separator. Then, in the field to the right, enter a symbol to use as the delimiter.
- To show a symbol before the number, indicating that this is currency, select Use Currency Symbol. Then, in the field to the right, enter the symbol to show.
- To show a percent sign after the number, indicating that this is a percentage, select Append Percent Sign.
- To show no value if the number is 0, select Blank When Zero.
- To show the negative symbol in front of negative numbers, select Show Negative Symbol.
- To show parentheses around negative numbers, select Show Parenthesis.
- To show negative numbers in a different color, select Color, then enter a hex value or use the color picker to choose a color.
- Optional: If you selected Date, you can choose which date and time components to display, and how to show them.
If the data field cannot be formatted as a number or date, then selecting one of those options will have no effect on the appearance of the data.
Reordering data rows
Sorting allows you to set the order that the data rows appear in each section. Click the Sorts  icon to open the list of sorts. Every data column in the ExpressView that is not a group column is automatically sorted.
You can choose which columns take precedence for sorting. The order of fields on the Sorts page is their order of precedence, from highest to lowest. Their order is also indicated by a number on the right of the column headers: The lower the number, the higher the precedence.
To set the sort precedence of data fields, either:
- On the Sorts page, drag fields up or down.
- Use
 radial>down to give a field the highest precedence.
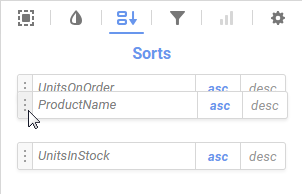
Dragging a sort to change its precedence
You can choose which direction to sort the data for each data field: ascending or descending. A field's sort direction is indicated by an arrow on the right of the column header: Up  for ascending, down
  for descending.
To change a field's sort direction, either:
- On the Sorts page, select asc for ascending, or desc for descending.
- Click the column header to swap to the opposite direction.
Narrowing your data
Filtering allows you to narrow the scope of your ExpressViews by restricting the amount of data shown. You can filter data by only showing rows whose values satisfy certain conditions. These are Standard filters. You can also filter data to only the rows with the top or bottom values, for either data fields or data summaries, per group iteration. These are Top N filters.
Click the Filters  icon to open the list of filters. The filters page has two tabs: Standard and Top/Bottom.
To show only the data that satisfies several conditions:
On the Filters page, click the Standard tab.
To add a data field to filter, either:
Use
radial>right on a data column or group.Drag a data field from the Data pane to the Meet all of the following conditions pane.
Note: This allows you to filter any accessible data field, not just those on the ExpressView.
Choose a filter operator from the list. See Filters for details.
Enter a filter value or values, or select them from the list.
Repeat steps 2-4 for every filter condition that the data must satisfy in order to show.
- If you are viewing live data, click Apply Changes to apply the filters.
To show only the data that satisfies at least one of several conditions:
On the Filters page, click the Standard tab.
To add a data field to filter, either:
Use
radial>right on a data column or group. Then drag the filter to the meet any of the following conditions pane.Drag a data field from the Data pane to the meet any of the following conditions pane.
Note: This allows you to filter any accessible data field, not just those on the ExpressView.
Choose a filter operator from the list. See Filters for details.
Enter a filter value or values, or select them from the list.
Repeat steps 2-4 for every filter condition, of which the data must satisfy at least one in order to show.
- If you are viewing live data, click Apply Changes to apply the filters.
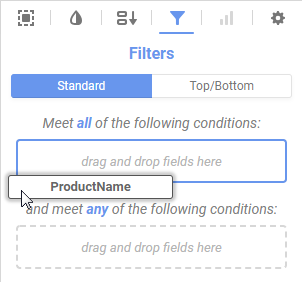
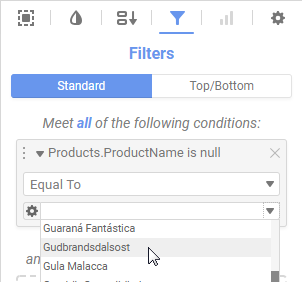
Adding a field as a Standard filter
To show only the top or bottom values, for either data fields or data summaries:
On the Filters page, click the Top/Bottom tab.
Select the Limit the report to the top/bottom values check box.
Select either Top or Bottom, for whether you want to show the top or bottom values.
Enter a number for how many values you want to show.
Choose how you want to limit your data:
If you want to show the rows with the top or bottom data values for a field or group, select Values from the list.
If you want to show the groups with the top or bottom summary values for a parent group or the ExpressView, select one of the summary calculations, Sum, Avg, Min, Max, Count, or Distinct Count, from the list. See the article on aggregation for more information.
Note: Only numeric data fields support Sum and Avg calculations.
Select the data field or group field to filter from the Of list.
Optional: To show the top or bottom values for each iteration of a group:
Click
 Add Group.
Select a group field from the For Each list.
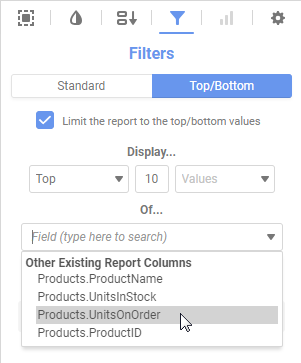
Adding a Top/Bottom filter