ExpressView Making visualizations
Charts allow you to showcase your data in a visual format. They allow you to quickly scan your data for patterns and trends. Charts can be easily made and customized in ExpressViews, in as little as one click.
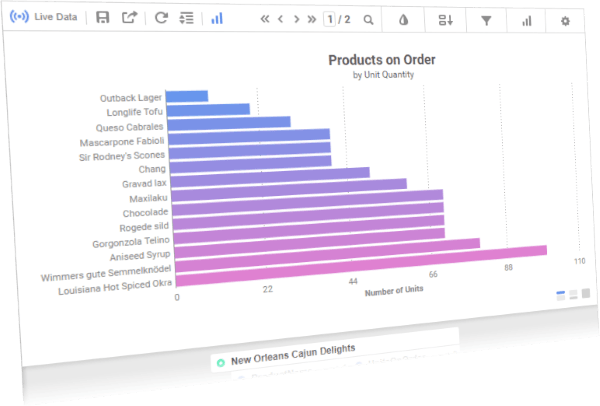
An ExpressView Visualization
To add a chart to an ExpressView:
Click the Show Visualization
 icon. A bar chart is added and populated with the data from your ExpressView.
In the Visualizations pane, select the type of chart you want to use. The chart immediately swaps to that type.
Click on a chart series to drill down into the data for that series. This filters the data columns to only the series you select.
You can add many more personal touches, small or large, to the visualizations you create. See the following sections for details on how to customize your visualizations.
Choosing chart data
When a visualization is first added, the application presets the chart fields to try to match the ExpressView data as closely as possible. This may not always match the data that you want the chart to use.
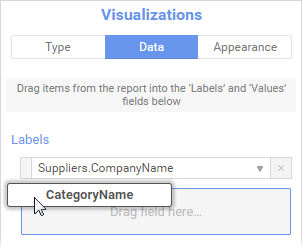
To see the chart data fields, click the Visualizations  icon, then click the Data tab. There are two fields: Labels and Values.
Labels
The Labels field is a group of data values, each iteration of the group represented as a series on the chart. For example, using an Employees group field as the label field represents each employee as a series.
Several charts allow an additional labels field. This is useful if you have a nested group, which represents common series to be measured across several groupings. For example, to compare the number of sales per product per employee, you could add a nested Product field as a second label to the aforementioned employees chart.
To add a chart label, either:
- Drag a data field onto the chart and release on the Add Label area.
- In the Visualizations pane, click the Data tab. Either:
- Drag a data field to the Labels area.
- Click
 Add Label, then select a field from the Field list.
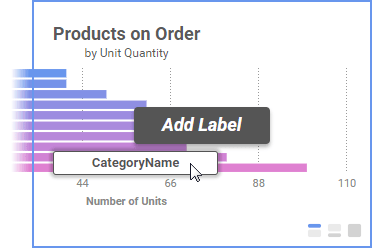
Drag a field onto the visualization or onto the Data tab to add it as a label
Values
The Values field is the data values to plot on the chart for each iteration of each labels group. For example, the number of sales per employee.
Several charts allow for multiple values fields. This is useful if you have common series to be measured across several groupings, and the values fields are in the same data row. For example, the number of sales and number of lost sales per employee.
To add a chart value, either:
- Drag a data field onto the chart and release on the Add Value area.
- In the Visualizations pane, click the Data tab. Either:
- Drag a data field to the Values area.
- Click Add Value, then select a field from the Field list.
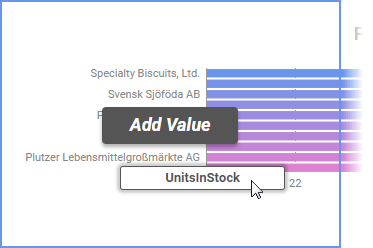
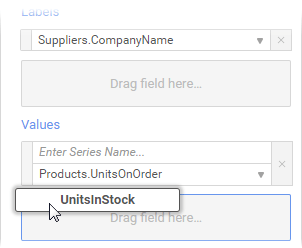
Drag a field onto the visualization or onto the Data tab to add it as a value
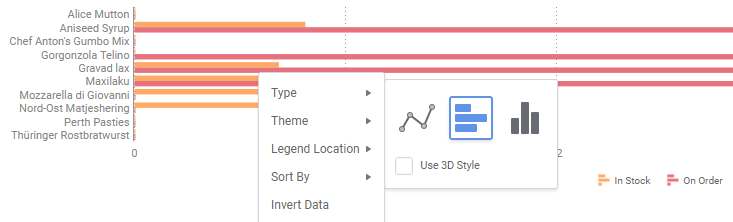
Interactive Editing of ExpressView Visualizations
You can invert the data, change the Type, Theme, Legend Location, or Sort of ExpressView visualizations by simply right-clicking with the introduction of interactive HTML to ExpressViews in 2018.2.
You can learn more about interacting with reports here and more about visualization types here.