...
| Panel |
|---|
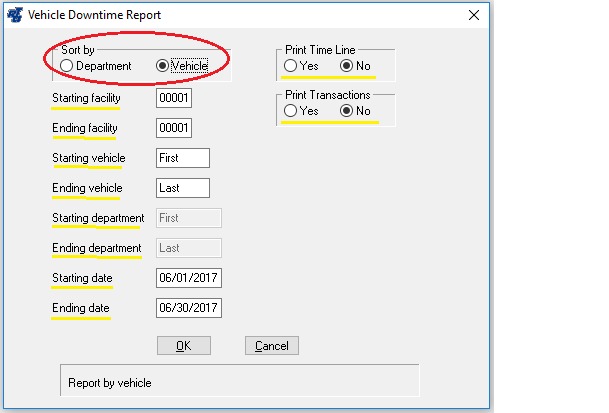
The Vehicle Downtime Report is sorted by Department or Vehicle. You are prompted for:
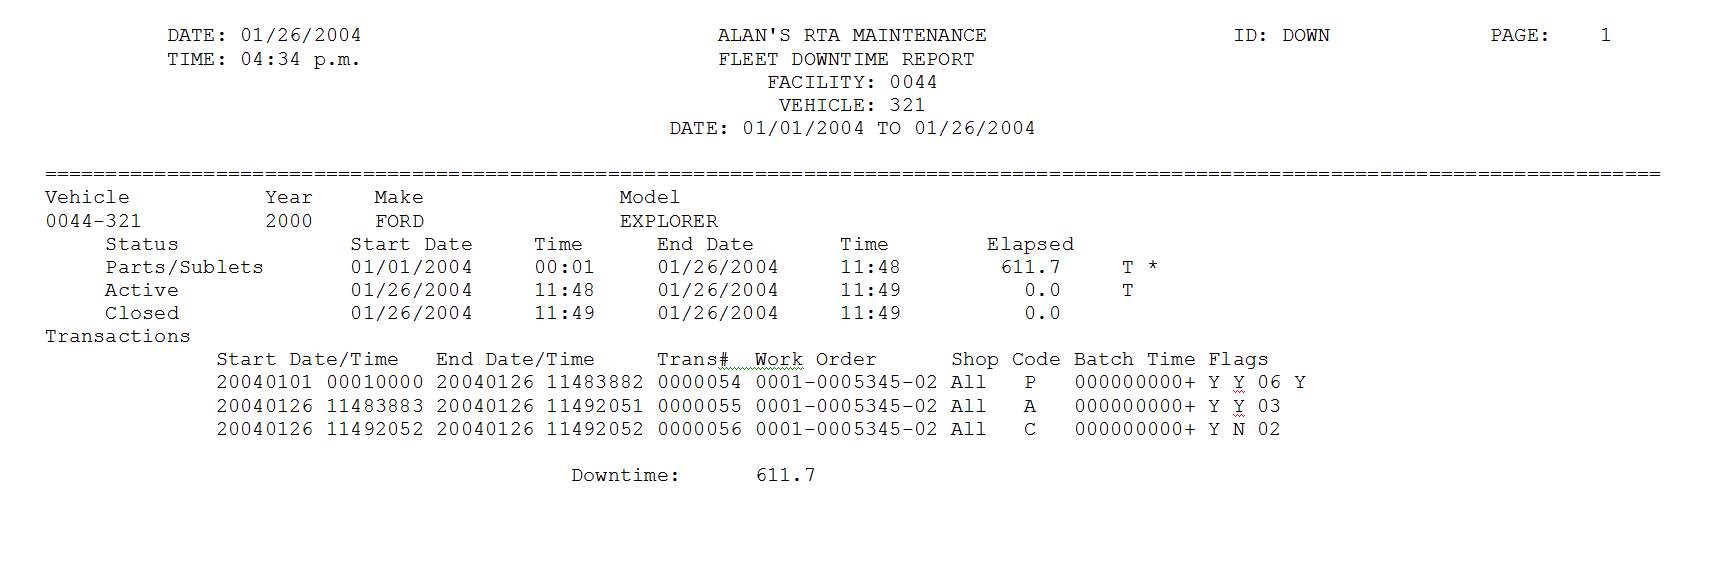
The report will display the following information: Page1: Vehicle Number, Year, Make, Model. Time Line: Status: Shows the Downtime Status Descriptions selected from the work orders. Start Date/Time of the Time Line. End Date/Time of the Time Line. Elapsed: Total time. A “T” in the line indicates the Status line is tracked. An “*” (asterisk) in the line indicates the actual date(s) of the line was different than the selected date range of the report. Transactions: Start Date/Time: End Date/Time: Transactions Number: Work Order Number Shop Code Status Code Batch Time: Flags: First Column, Y=Transaction Closed Second Column, Y=Transaction Tracked. Third Column, Priority of the Downtime Status Code. Fourth Column, Y=Either the actual Beginning or Ending Transaction Date does not fall within the range of the dates selected for this report. Downtime: Total Downtime for the report.
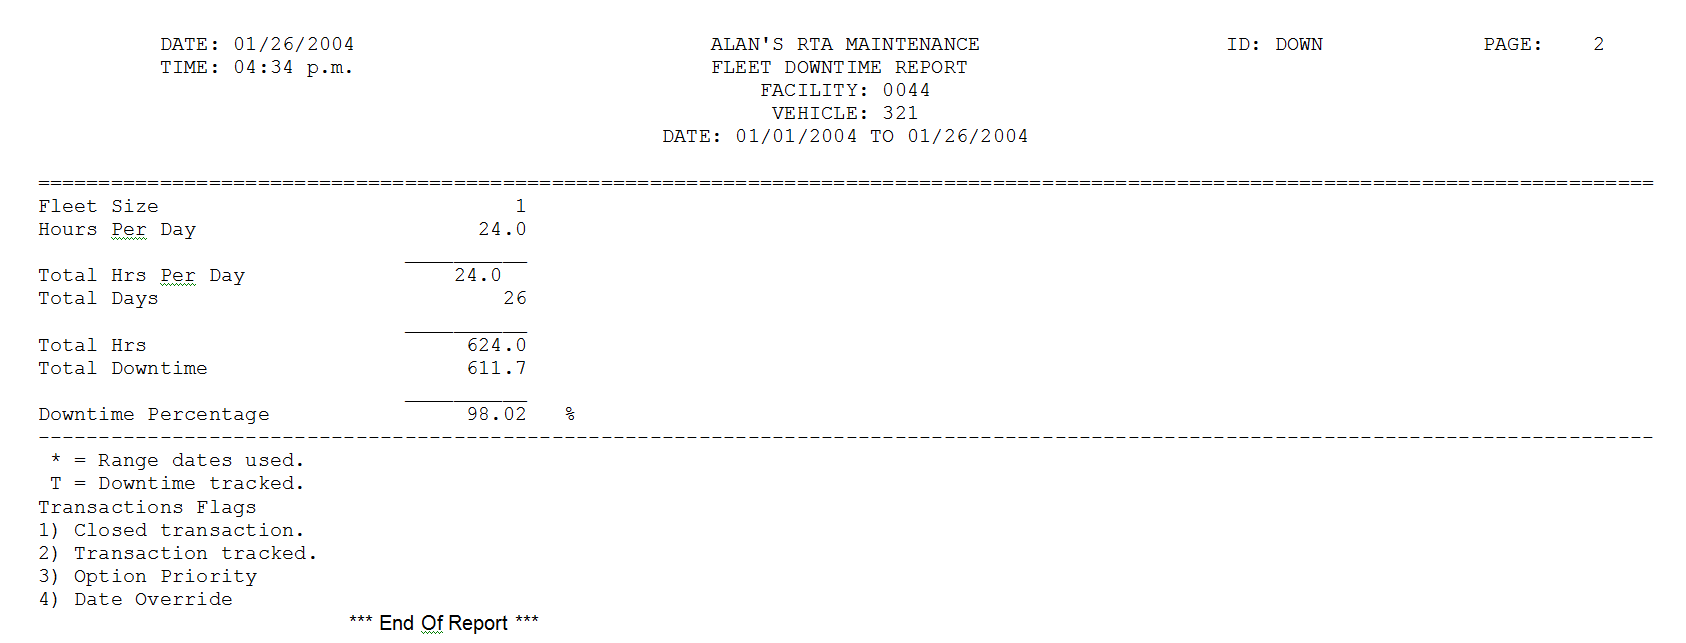
Page2: Fleet Size = Number of vehicle processed for the vehicle range. Hours Per Day = Number of hours per day entered in the Downtime setup screen (see setup above). Total Hours Per Day = (Hours Per Day ´ Fleet Size). Total Days = Total days selected by the user, within the report date range. Total Hours = (Total Hours Per Day ´ Total Days). Total Downtime = Total Downtime from page 1 of report. Downtime Percentage = (Total Downtime ¸ Total Hours).
|

...